When evaluating the potential purchase of a commercial real estate asset, one of the most obvious questions for an investor to ask themselves is, “what is my potential return on investment?” To answer this question, there are three commonly used financial metrics, Cap Rate, IRR and Equity Multiple, each of which provide a slightly different insight into the potential return. As a tool for return measurement, each of these commercial real estate metrics has their pros and cons, but together they can tell the whole story about the potential profitability of an investment.
The Proforma & Net Operating Income
A necessary precursor to calculating these commercial real estate return metrics is the creation of a “Proforma”, which includes a line item for Net Operating Income, which is the key input for each metric.
A Proforma is a projection of the future income and expenses for the property over a defined holding period. Although it is a projection, it isn’t a guess. It is based on the historical performance of the property and assumptions that are rooted in market based data. Although the specifics vary by property, each proforma contains the same general line items:
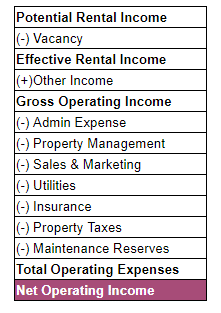
The Cap Rate for each year in the investment holding period, these line items need to be estimated so that Net Operating Income can be calculated. Because each of the three return metrics uses Net Operating Income as an input, creating a Proforma and calculating it is a necessary first step to estimating potential returns.
A property’s Capitalization (“Cap”) Rate serves two purposes. First, it is a measure of a property’s annual rate of return assuming an all cash purchase. Second, a property’s Net Operating Income can be “capped” in the final year of the holding period to estimate a potential sales price.
In the first use case, the formula for calculating the Cap Rate is:
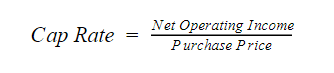
For example, if a property’s Net Operating Income in year 1 of the proforma is $100,000 and it has a purchase price of $1,000,000, the resulting Cap Rate is ($100,000 / $1,000,000) 10%. That is to say, if an investor purchased this property with $1,000,000 in cash, they could expect a 10% return in year 1 of the holding period.
In the second use case, the formula can be rearranged to calculate a property’s “exit” value, which is the estimated sales price at the end of the holding period. The new formula is:
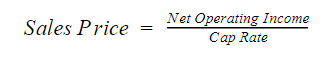
In this formula, the choice of Cap Rate requires an assumption about what it will be at the time of sale, which may be many years into the future. For example, if the Net Operating Income in the final year of the investment holding period has grown to $150,000, but the Cap Rate stays the same at 10%, the estimated sales price would be ($150,000 / 10%) $1,500,000.
Because the Cap Rate is meant to reflect an annual return, what determines a good cap rate in commercial real estate varies. A risk averse investor may be fine with a Cap Rate of 5% and the relative safety that comes with it. But, another investor may need a 10% Cap Rate and is willing to take the risk to achieve it. In general, the Cap Rate for most investment grade commercial real estate properties ranges from 4% – 10%.
The Internal Rate of Return
The Internal Rate of Return is the discount rate that sets the net present value of all future cash flows equal to zero. It is used as a proxy for the compound annual rate of return on a series of cash flows and it can be easily calculated using the “IRR” function in a spreadsheet.
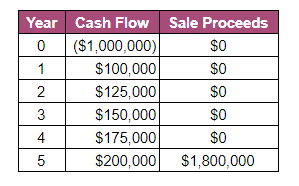
The cash flows used to calculate IRR are the ones left over after the property’s loan payments have been made. In most cases, there is a “year 0” that represents the funds used as a down payment on the property, followed by a series of regular cash flows that represent the operating profits from the property. Then, in the last year of the holding there is a large chunk of money that represents the proceeds from a sale. To illustrate this point, consider the following set of cash flows for a property that is held for 5 years:
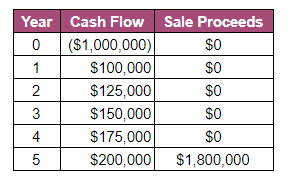
In this set of cash flows, year 0 represents the initial equity contribution of $1M. Then years 1-5 have a set of operating cash flows which represents the property’s income, less expenses (including debt service). Then, in year 5, the property is sold and there is a big influx of cash. To calculate this using the IRR function in a spreadsheet, the input would look like this:
=IRR(-$1,000,000, $100,000, $125,000, $150,000, $175,000, $2,000,000)
This set of cash flows results in an Internal Rate of Return of 23.91%, which is a rough approximation of the expected annual return on this investment.
Like the Cap Rate, there is no “right” IRR, the requirement is different for every investor. However, in general there is a range of acceptable IRRs depending on the investment type:
- Core Investments (low risk, low reward): 8% – 12%
- Value Add Investments (medium risk, medium reward): 12% – 16%
- Speculative Investments (high risk, high reward): 16% +
It is important to note that IRR is based on a projection of cash flows many years into the future. There is a strong likelihood that the actual IRR will be different from the original estimate, but it provides a point of reference from which to make a decision about whether or not to proceed with the investment.
Equity Multiple
One of the limitations of using IRR as a method of measuring returns is that it does not give an investor a good idea of the property’s absolute return. For example, a $100,000 investment that returns $105,000 in 1 month has an IRR of ~80%, which seems great, but in reality the investor only made $5,000 in absolute return. Enter the Equity Multiple.
The Equity Multiple helps to measure an investment’s absolute return and it is calculated as follows:
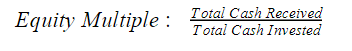
Continuing the example above, the same set of cash flows can be used to calculate the Equity Multiple:
The total cash received from this investment is $2.55M and the total cash invested is the $1M in year 0. Thus, the Equity Multiple is calculated as ($2,550,000 / $1,000,000) 2.55x. Another way to interpret this is that the investor would make 2.55x their original $1M investment. The Equity Multiple solves for the major deficiency of IRR in that it provides an indication of exactly what an investor’s absolute return is.
Again, there is no “right” Equity Multiple because it is different for every investor, but 2.5x or greater is typical for a commercial real estate investment.
Interested In Learning More?
First National Realty Partners is one of the country’s leading private equity commercial real estate investment firms. With an intentional focus on finding world-class, multi-tenanted assets – including middle-market service-oriented retail shopping centers – well below intrinsic value, we seek to create superior long-term, risk-adjusted returns for our investors while creating strong economic assets for the communities we invest in.
When evaluating an investment opportunity, we review all three metrics as an indication of potential profitability and communicate them as part of the information provided to potential investors.
To learn more about our investment opportunities, contact us at (800) 605-4966 or ir@fnrpusa.com for more information.

